Things Happened, Lessons Learned
Jul. 3rd, 2020 07:55 pmSo... like I said, things have happened. It's time to look back at how I did with my predictions from July 4th of last year. It's going to be a rough ride, but I think I've learned something useful from it.

Cataloging my predictions from the original post and the first and second coronavirus follow-ups, here's what I listed:
I started thinking of some possible causes for what happened:
The pandemic helps calibrate this, as it has a relatively clear-cut beginning, at least compared to long-term, ongoing trends. Another hint comes from the federal bureaucracy prediction, and in particular something I noticed over the course of the last year. For most of Trump's term there has been a continual trickle of leaks about the administration, some attributed to specific people, some anonymous. For a period of time, though, the anonymous leaks in the media shifted to focus on Ukraine and the Bidens. With John Bolton's recent book, things have reverted back to the original pattern. Looking at just the first part of the 12-month period, the predictions hold up much better.
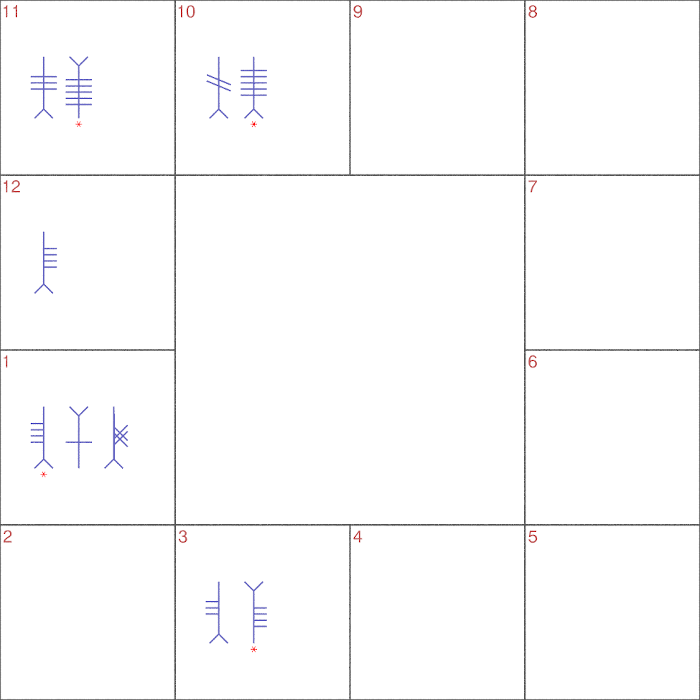
Thus, here is my hypothesis: these charts are effective for a number of months equal to the number of filled houses. In this case, that would have been five months, ending in early December just as the impeachment hysteria was building to a crescendo (before ultimately crashing into a colossal political nothingburger). Since I didn't think of this at the time, my grade for this round still comes in at an F. Going forward, though, I'm going to give it a try.
There are also two additional practical benefits I can see. First, it's generally easier to make predictions over shorter timeframes. Second, there's a roughly 1-in-4000 chance of a completely blank chart with this method. Previously, that would have been an awkward result -- can there really be no forces influencing a country for a whole year? Now, it means a zero-month chart and thus should just be immediately re-generated.

Cataloging my predictions from the original post and the first and second coronavirus follow-ups, here's what I listed:
- the major media will get even more ridiculous
- ...but audiences will increasingly ignore the hysterics and focus on day-to-day life
- Congressional Democrats will continue their political fights with Trump
- ...but they'll end up getting walloped thoroughly
- ...enough that the federal bureaucracies finally fall in line behind the president
- All in all, we can expect another turn of the ratchet in the long-term trend that political wonks sometimes refer to as the "imperial presidency" -- the tendency for more and more responsibility for policies and decisions to shift from the legislative branch to the executive.
- As for other matters, such as financial markets, the real economy, and foreign relations? No major breakthroughs, but no major disasters either. Muddling along is what we have in store.
- Specifically, there is no indication that coronavirus will be a significant factor in the US, at least not over the time period in question
- I expect the overall death toll in this country to be manageable at the societal level
- I expect the stock market in July to resemble the stock market in July 2019 -- it won't be at the all-time highs, but it won't be Depression 2.0 either.
- However, in the context of a pandemic, particularly one that disproportionally kills older patients, there is the possibility that in this specific situation it could mean a death... From its placement in the 11th house (lower chamber of Congress), my best guess is that -- if this is the correct reading for those symbols in this context -- it's Speaker of the House Nancy Pelosi who's at risk.
- (And a major event that happened that wasn't addressed by any predictions): the coronavirus-related lockdowns across most of the country
I started thinking of some possible causes for what happened:
- Divination just doesn't work
- I got poor "reception" on this particular reading
- I interpreted the results poorly
- Divination can't give me any answers that I don't already think are at least possible (similar to the problem of the "black swan" phenomenon)
- The chart didn't apply to the full year
The pandemic helps calibrate this, as it has a relatively clear-cut beginning, at least compared to long-term, ongoing trends. Another hint comes from the federal bureaucracy prediction, and in particular something I noticed over the course of the last year. For most of Trump's term there has been a continual trickle of leaks about the administration, some attributed to specific people, some anonymous. For a period of time, though, the anonymous leaks in the media shifted to focus on Ukraine and the Bidens. With John Bolton's recent book, things have reverted back to the original pattern. Looking at just the first part of the 12-month period, the predictions hold up much better.
Thus, here is my hypothesis: these charts are effective for a number of months equal to the number of filled houses. In this case, that would have been five months, ending in early December just as the impeachment hysteria was building to a crescendo (before ultimately crashing into a colossal political nothingburger). Since I didn't think of this at the time, my grade for this round still comes in at an F. Going forward, though, I'm going to give it a try.
There are also two additional practical benefits I can see. First, it's generally easier to make predictions over shorter timeframes. Second, there's a roughly 1-in-4000 chance of a completely blank chart with this method. Previously, that would have been an awkward result -- can there really be no forces influencing a country for a whole year? Now, it means a zero-month chart and thus should just be immediately re-generated.